Entity Price Charting Widget
The Entity Price Charting Widget shows a graph of historical pricing information for a Public Company, ETF, ETN, or Currency. It is available as part of the Market Data Package.
Widget Navigation
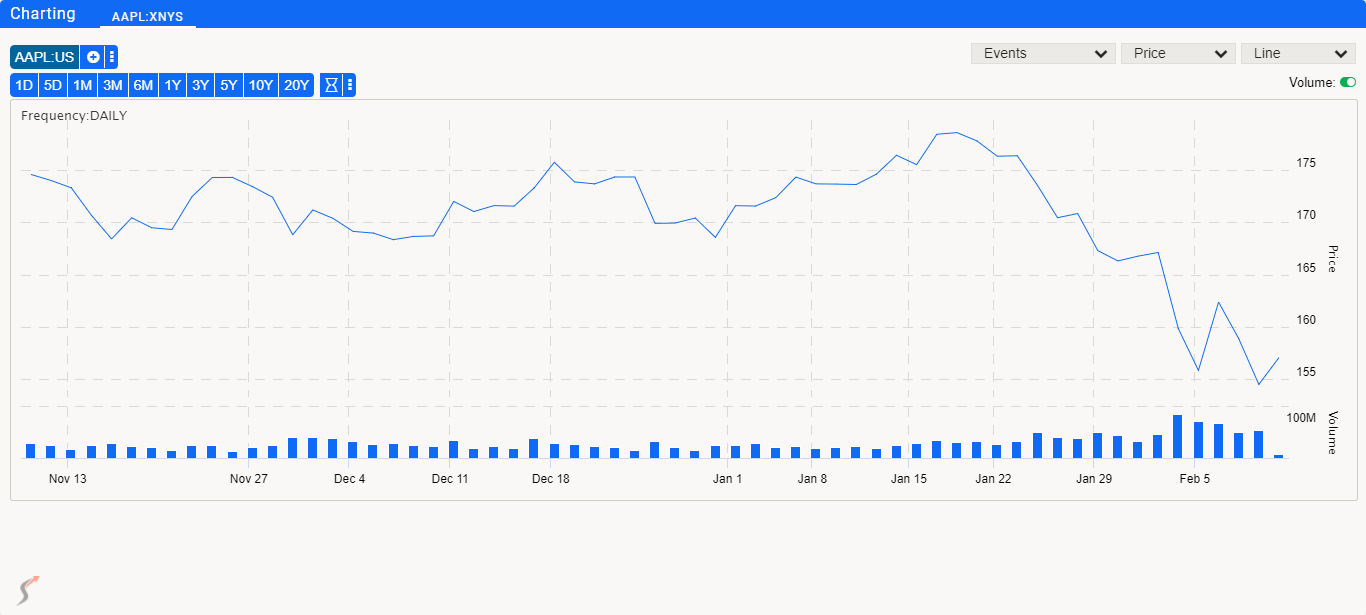
The Entity Price Charting Widget is designed to give you several ways to interact with the chart. Starting in the upper left, you can add either another Symbol to add to the chart or select and Index using the three verticle dot menu on the right.
Below the Symbol Entry area, are buttons to give you quick access to various time intervals to use in the graph and next to the time intervals is a drop down menu giving you access to change the frequency from daily, to weekly or monthly.
On the top right are three drop down menus.
- Events (../widgets/Show Events by type.md)
- Earnings
- Dividends
- Splits
- Price (../widgets/Price Type to display.md)
- Price
- % Change
- \$ Change
- Line (../widgets/Graph Type to display.md)
- Line
- Area
- OHLC
- Candlestick
- Hollow Candle
Below the three drop down menus is a slider to turn on and off the volume chart below the price chart.
Click Here for Entity Charting Options
Home PowerIntell.AI™ Apollo Pro® RegLens®